What changed in the first half
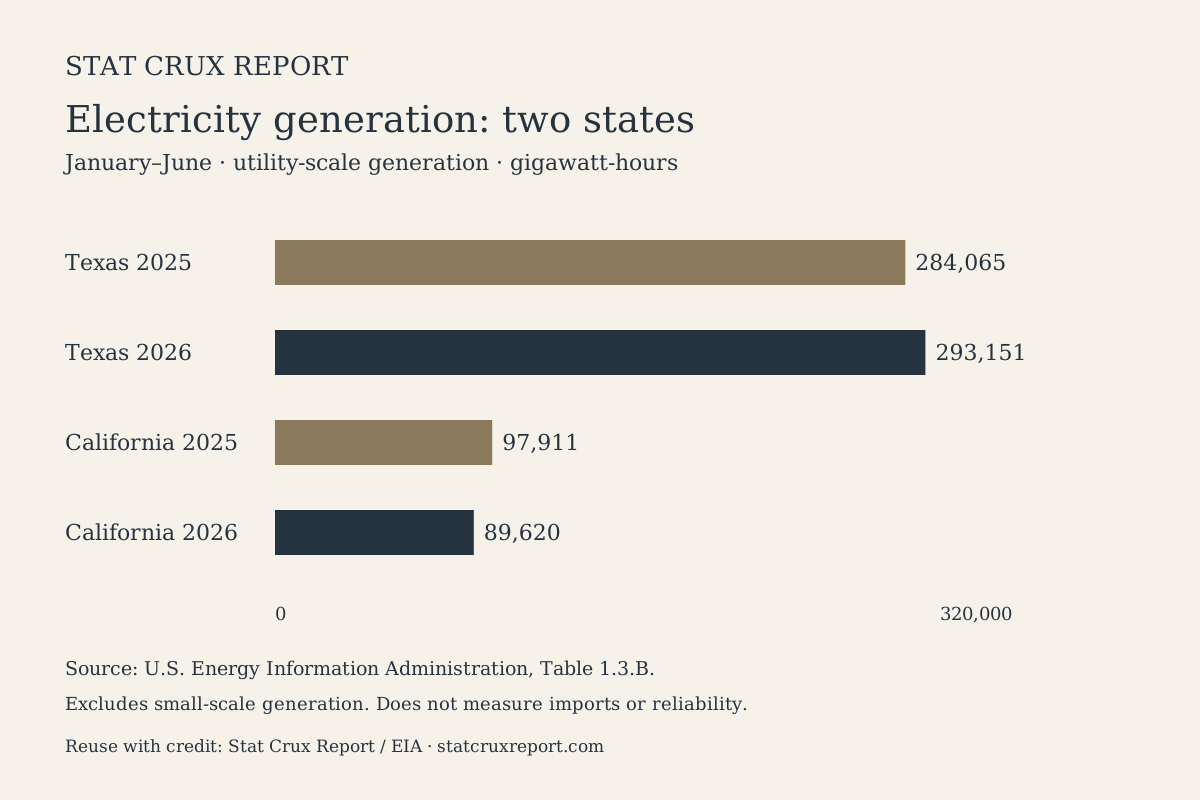
Texas led U.S. states in the increase in utility-scale electricity generation during the first half of 2026, while California recorded the largest decline. The Energy Information Administration’s state table shows Texas produced 293,151 gigawatt-hours, up 3.2 percent from the same period in 2025. California produced 89,620 gigawatt-hours, down 8.5 percent.
The comparison is between January–June totals in each year. Texas rose from 284,065 gigawatt-hours, a gain of 9,086. California fell from 97,911, a decline of 8,291. Those are changes in electricity produced inside each state, not a scorecard of how reliably either state supplied its customers.
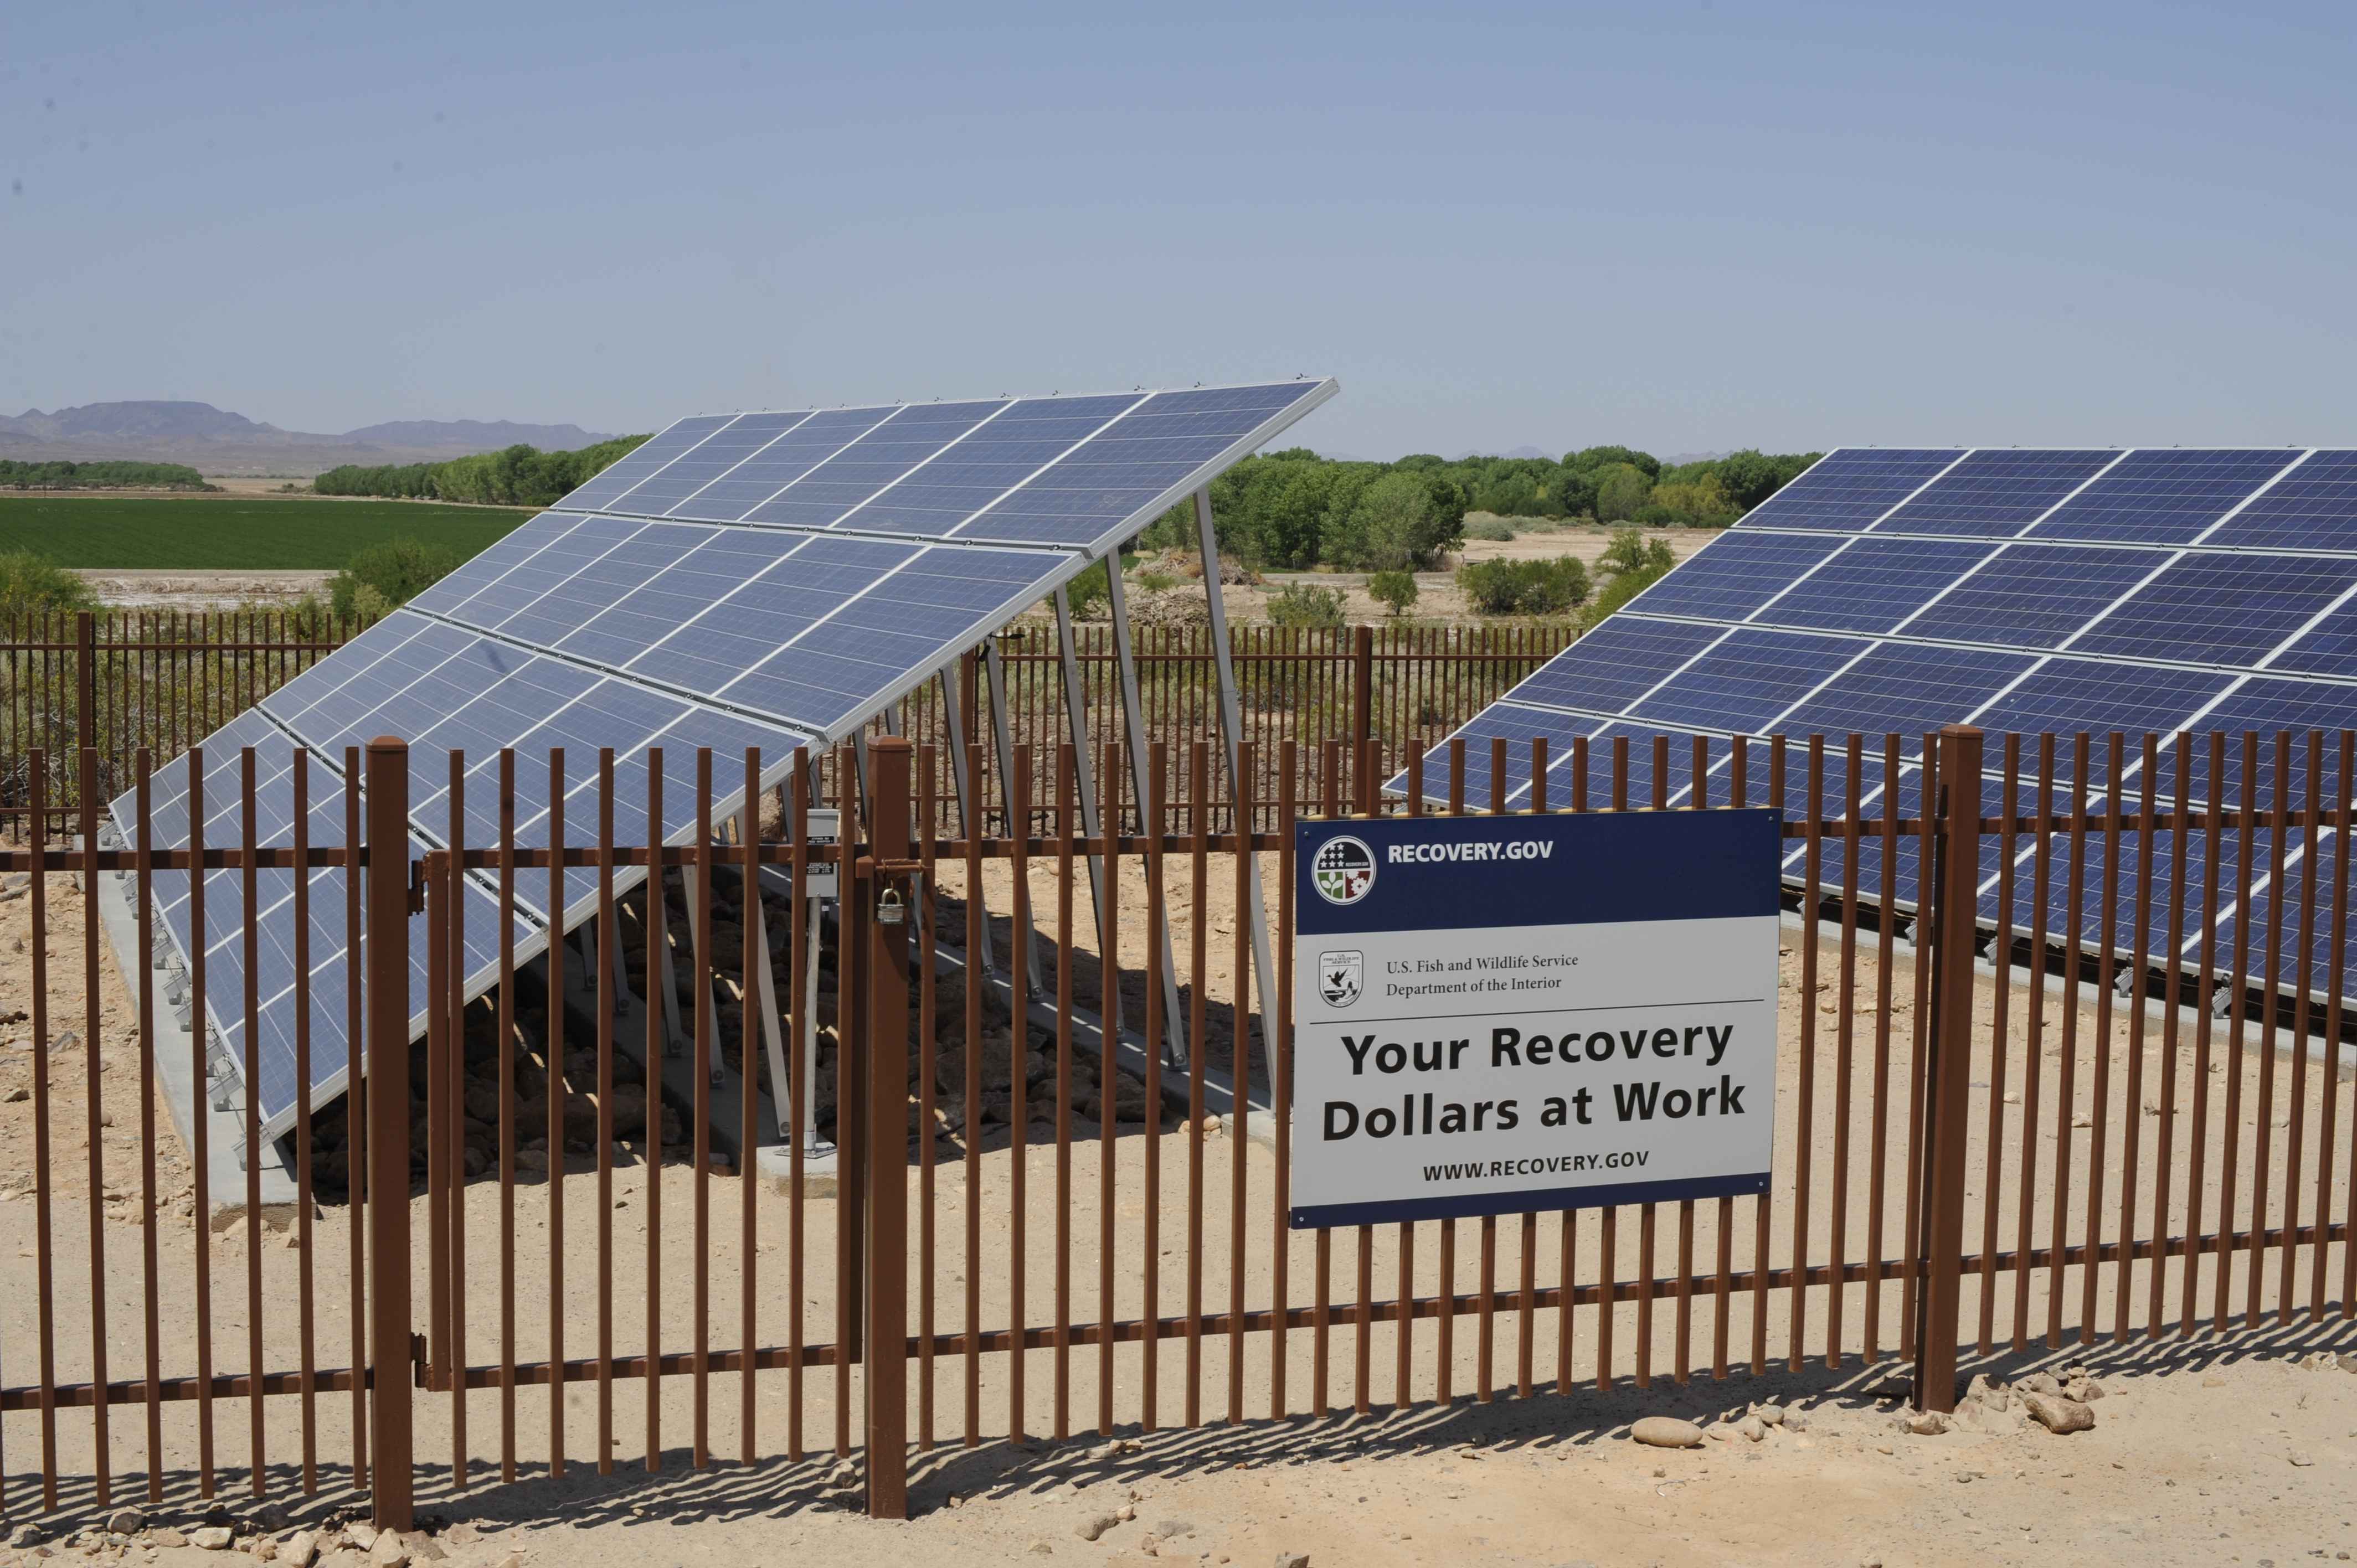
In its September 3 analysis, Inside Climate News identified utility-scale solar as the principal source of Texas’s gain. Solar production increased by 9,373 gigawatt-hours, more than the state’s overall net increase. That means growth in solar was partly offset by changes in the rest of the generating mix.
Generation is not capacity
A gigawatt-hour measures energy produced over time; generating capacity measures the power a plant can supply at a given moment. EIA explains that conditions at a power plant, fuel costs, and instructions from grid operators can affect actual production. A change in output therefore does not, on its own, establish how much new capacity was built.
EIA’s utility-scale table also excludes small-scale generation such as many rooftop solar installations. Inside Climate News identified lower natural-gas generation, solar and battery use, and imported electricity as context for California’s result. The state total alone cannot measure electricity imported across state lines or the complete contribution of customer-owned solar.
How prices compare
Retail prices answer a different question. EIA’s June 2026 table puts the average residential price at 15.94 cents per kilowatt-hour in Texas and 34.74 cents in California. Across all customer sectors, the respective averages were 10.62 and 28.50 cents. These are statewide averages, not a particular household’s tariff or bill.
For illustration, 1,000 kilowatt-hours priced at the reported residential averages would equal $159.40 in Texas and $347.40 in California. This calculation simply multiplies the published cents-per-kilowatt-hour figures by the same amount of electricity; it is not a quotation for service and does not reproduce an individual utility’s billing structure.
What the figures cannot establish
The production figures cover six months, while the prices describe June. Neither is a full-year result. Establishing why bills differ would require examining costs, customer usage, utility rates and other factors beyond the two generation totals. The data do not establish that California’s lower in-state generation caused its higher average price.